UK Migration Statistics 2025 — Work, Study, Family, Visitor & ETA Trends (Updated Sept 2025)
Summary
In the year ending June 2025:
- 134.8 million total arrivals to the UK (56% British nationals).
- 2.2 million Visitor visas granted + 18,521 Transit visas.
- 13.4 million ETAs approved since launch in October 2023.
- 852,324 non-visit visas (Study, Work, Family, Other).
- 49,341 irregular arrivals detected.
- Net long-term migration for 2024: 431,000 (ONS provisional).
These numbers highlight the UK’s complex migration system: a mix of tourism, short-term visits, education, labour mobility, humanitarian schemes, and irregular flows.
“Figure 1: Visas issued for entry to the UK by main category (excluding visitor and transit routes), alongside detected irregular arrivals, year ending June 2025 (covering both main applicants and dependants).”
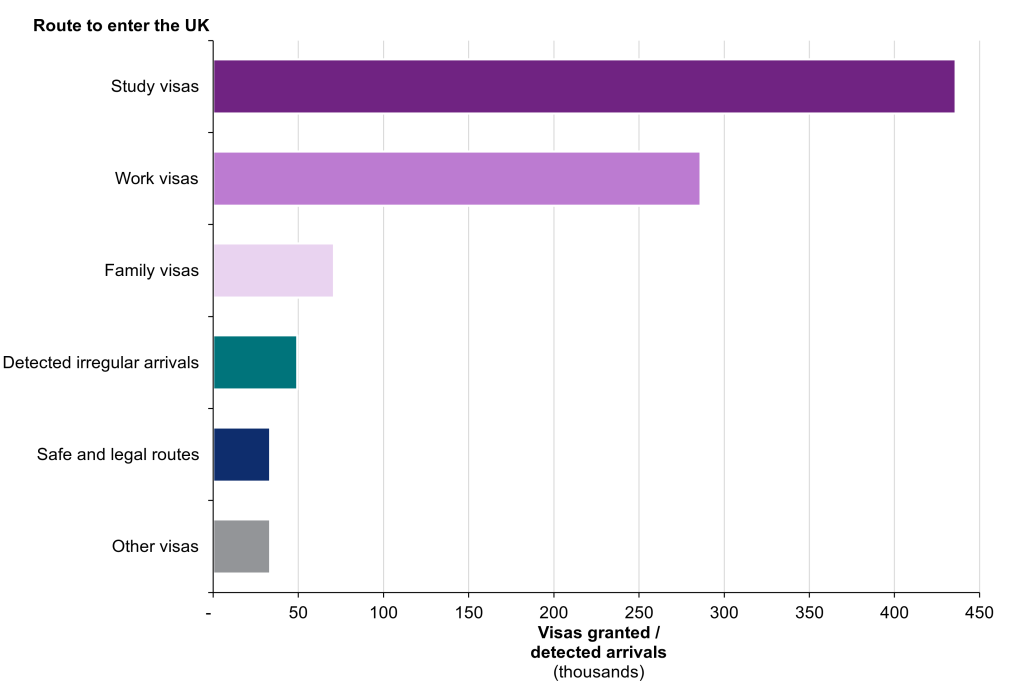
Source: Entry clearance visa applications and outcomes – Vis_D02, Safe and legal (humanitarian) routes summary tables – Hum_01, Irregular migration to the UK – Irr_D01
1. Passenger Arrivals to the UK
- Total arrivals (YE Jun 2025): 134.8m (+5% YoY).
- Nationality split: 56% British, 44% foreign nationals.
- Mode of travel: 88% by air, 7% by rail, 5% by sea.
📊 Trend note: Arrivals are now 9% higher than pre-pandemic (2019). Travel restrictions during COVID caused a steep dip in 2020–21, but recovery has been strong since mid-2022. (see Immigration and border statistics relating to COVID-19).
“Figure 2: Monthly passenger arrivals in the UK, by nationality (British vs foreign), from January 2022 to June 2025.”

2. Visitors & Short-Term Stays
Visitor Visas
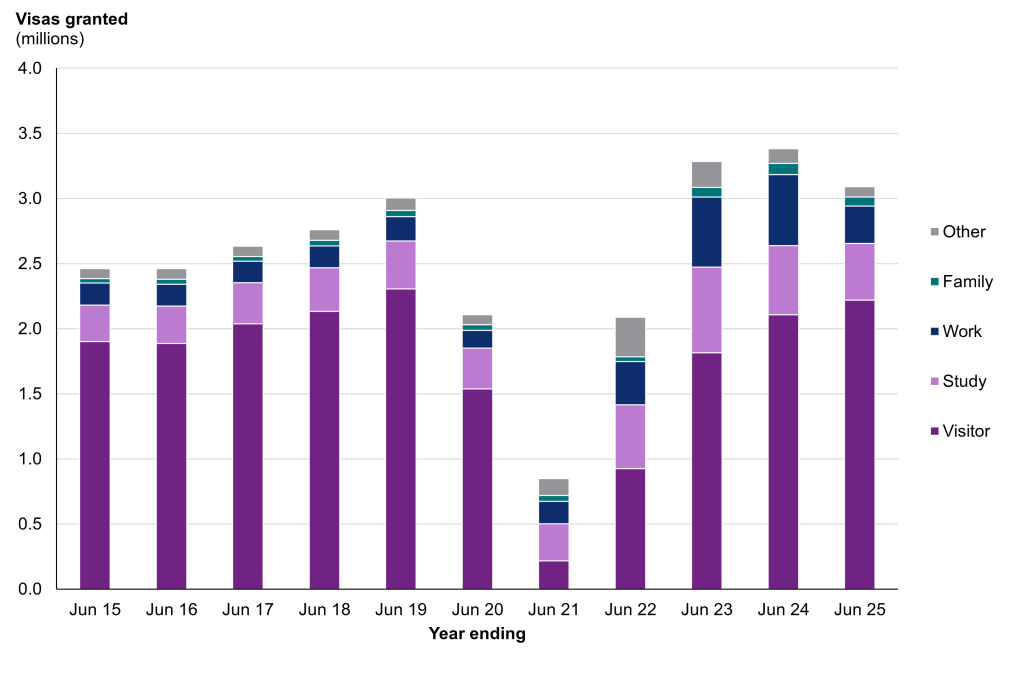
- 2.2m Visitor visas granted (YE Jun 2025) (+5% YoY, still below 2019 peak of 2.4m).
- Nationality breakdown:
- India — 563,665 visas (+6% YoY, highest overall).
- China — 486,553 (steady decline since pandemic).
- Turkey — 208,294 (+148% vs 2019).
- Saudi Arabia — steep decline since Feb 2024, when nationals became eligible for ETAs.
- Russia — sharp fall since 2022 due to Ukraine war and sanctions.
Transit Visas
- 18,521 Transit visas issued in YE Jun 2025.
3. Electronic Travel Authorisations (ETAs)
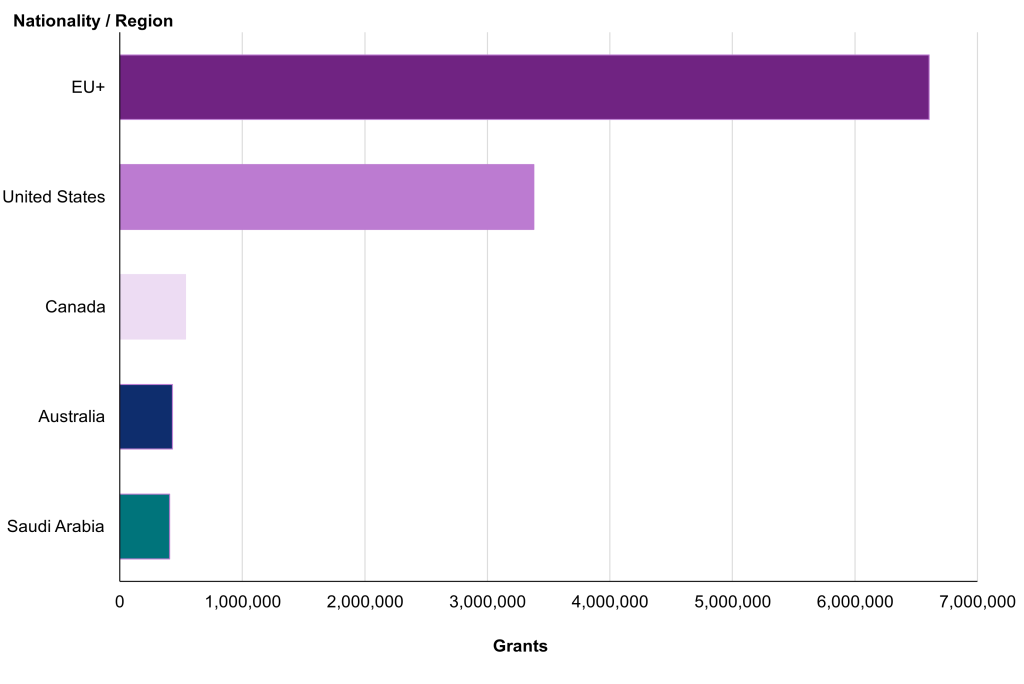
- 13.4m ETAs granted (Oct 2023 – Jun 2025).
- Nationality breakdown:
- USA — 3.4m (largest single nationality).
- Germany — 1.3m.
- France — 922,793.
- EU+ nationals (EU, EEA, Switzerland) — 6.6m (49%) of all ETAs.
📊 Key insight: ETAs now outnumber visitor visas. This reflects policy shifts: countries once visa-free now require ETAs for tracking/security.
Figure 4: ETAs issued to EU+ nationals and other leading nationalities, October 2023 – June 2025
(Suggested chart: ETA grants by top 10 nationalities, Oct 2023–Jun 2025)
4. Non-Visitor Entry Clearance Visas
Total 852,324 non-visit visas issued in YE Jun 2025 (−32% YoY but still +16% vs 2019).
Breakdown:
- Study visas — 435,891 (−18% YoY).
- Drop due to dependant restrictions (Jan 2024).
- Dependants fell 81% YoY (from ~95k → ~18k).
- Work visas — 286,071 (−36% YoY).
- Health & Care fell to 20,516 (−77% YoY).
- Salary thresholds now £38,700+, with ISL exceptions.
- Family visas — 70,961 (−15% YoY).
- Partners = 42,251.
- New income threshold: £29,000 (renewals exempt).
- Other visas — 59,401.
- Includes Ukraine/BNO schemes, settlement, dependants joining.
Source: Entry clearance visa applications and outcomes – Vis_D02
5. Humanitarian & Safe Routes
- 61,832 humanitarian grants (YE Jun 2025) (−33% YoY).
- Includes:
- 7,445 refugees resettled (88% via Afghan Resettlement).
- Ukraine Scheme declining after initial 2022–23 surge.
- Family reunion visas counted separately under family visas.
6. Irregular Migration
- 49,341 irregular arrivals (YE Jun 2025).
- 88% via small boats across the Channel.
- Average 56 people per boat in 2025, making crossings more concentrated.
(Suggested chart: Line graph of irregular arrivals 2018–2025)
7. Policy Updates & Government Plans
The May 2025 White Paper — “Restoring Control Over the Immigration System” proposed:
- Graduate Route cut from 2 years → 18 months.
- English tests for dependants.
- Higher employer sponsorship costs.
- 10-year residence rule before ILR (up from 5 years).
Debate:
- Employers warn of shortages (NHS, care, agriculture, construction).
- Universities warn about falling overseas enrolment.
- Government claims reforms will halve net migration by 2026.
8. Methodology & Data Sources (Why the numbers differ)
- Passenger arrivals: counts every crossing, includes multiple entries by same person.
- Visas: counts documents issued, not trips taken.
- ETAs: each grant = multiple potential entries.
- Irregular arrivals: only detected cases, true numbers may be higher.
- Net migration (ONS): focuses on long-term movers (≥12 months stay).
9. Net Migration (ONS)
- 2024 provisional net migration:431,000.
- Arrivals: 948,000.
- Departures: 517,000.
- Down from 860,000 in 2023 (almost halved).

10. Key Takeaways
- The UK is still a global hub for mobility, but post-pandemic & post-Brexit policy has slowed inflows.
- ETAs are reshaping short-term travel patterns.
- Student and work visas fell sharply in 2025 due to new restrictions.
- Irregular migration remains politically charged, despite falling net migration overall.